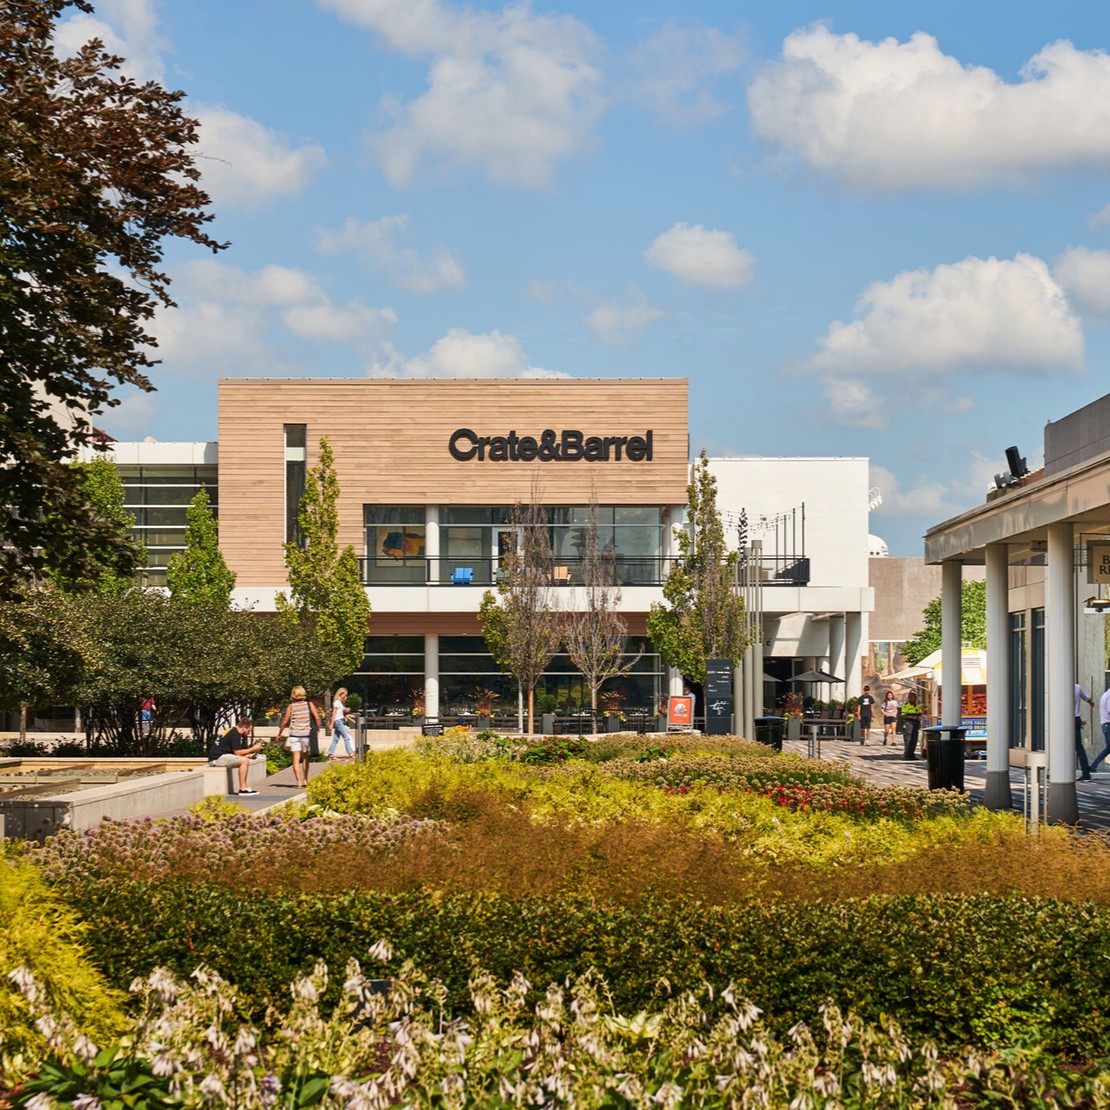
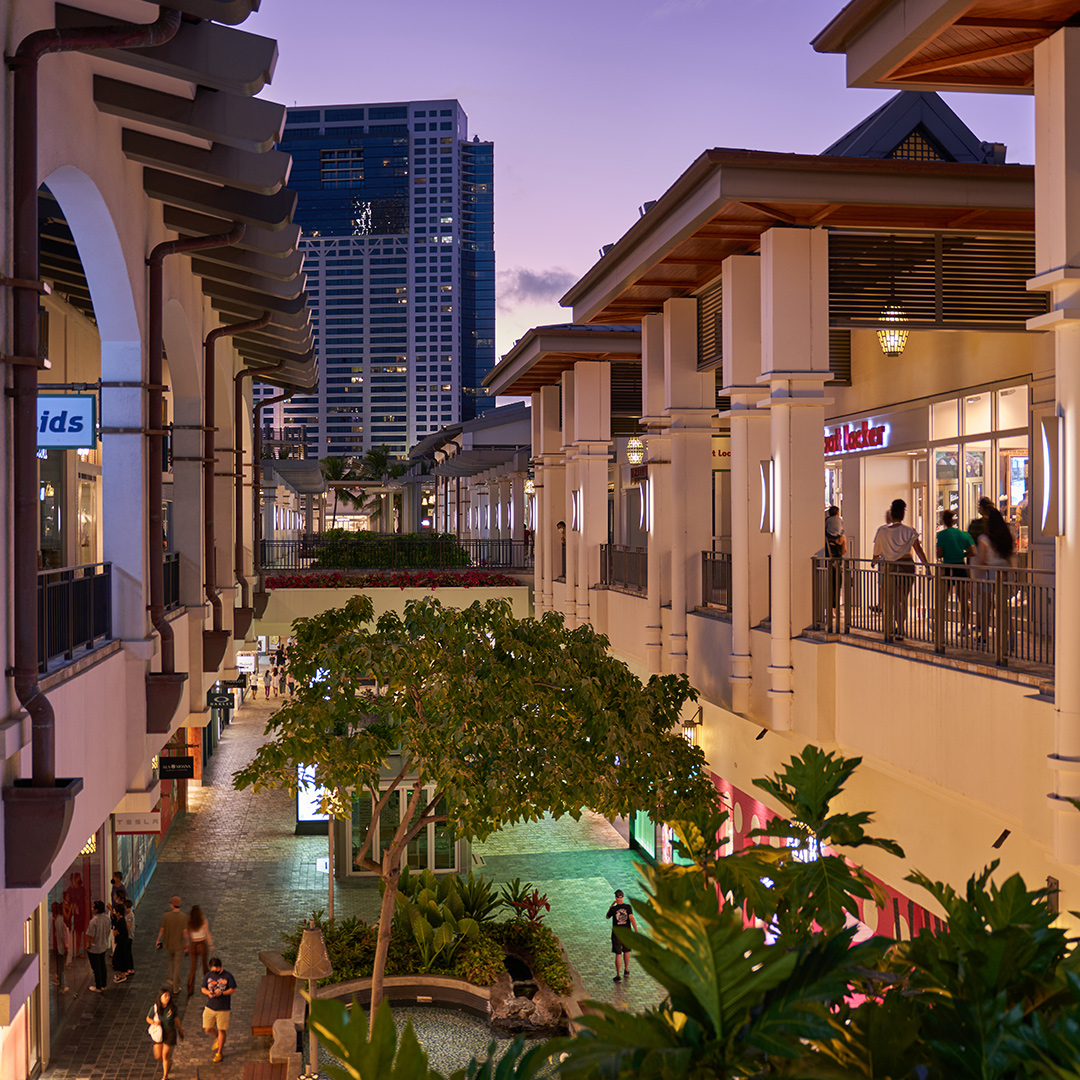
NRN: a national research network
Trend Bites [a taste of what's going on out there for the consumer to experience]

Trend Bites

Trendbites Home

Most Recent Posts

Other Reading Options

PDFWordPrintTrend Bites RSS Feed

Bookmarking

Are you and Optimist or Pessimist when it comes to the economy? See how you compare to the rest of America. [Issue 14; March, 2009]

In order to better understand the consumers’ perspectives on the economy , we have defined two groups that are either optimists or pessimists.The optimists believe the economy will improve over the next six months or they think it will remain as "average", "good", or "excellent". Pessimists, on the other hand, believe the economic condition will get worse over the next six months or they think it will remain as "poor". Pessimists make up over half (61%) of the population, while optimists represent just under one-third (30%) of the population (see below).

Consumers’ View of Current Economic Condition vs. Anticipated Economic Condition 6 Months from Now (Among All Consumers)
Anticipated Economic Condition 6 Months From Now   View of Current Economic Condition
  Average, Good, or Excellent Fair Poor Total
Better 6% 3% 9% 17%
About the same 12% 9% 20% 41%
Worse 3% 5% 33% 41%
Total 21% 17% 62% 100%

There are differences in the demographic make-up of pessimists and optimists. Significantly more men than women have a positive outlook on the economy (54% and 47%, respectively). Pessimists also tend to be older than optimists, and as one would expect, have higher household incomes, on average. In addition, significantly more optimists than pessimists live in the East (27% and 17%, respectively).

Demographics of Optimists and Pessimists
Demographics Optimists Pessimists
Gender Male* 54% 48%
Female* 47% 52%
Age 18-24* 13% 6%
25-34* 22% 14%
35-44 19% 20%
45-54 19% 23%
55-64 14% 18%
65+* 13% 20%
Average Age* 43.9 49.3
Household Income Less than $35k* 27% 32%
$35k - $49.9k 20% 19%
$50k - $74.9k 22% 21%
$75k - $99.9k 16% 13%
$100k+ 16% 14%

Average Household Income*

$70,774 $60,468
Presence of Children Under 18 in Household Yes 27% 28%
No 73% 72%
Region East* 27% 17%
Midwest 26% 30%
South 28% 33%
West 19% 21%